Free chart · PDF
How much rent can I afford? Income chart
Monthly rent you can afford at 30% and 25% of gross income, and the highest rent that passes the common landlord test of monthly income at 3 times the rent.
What is on this chart
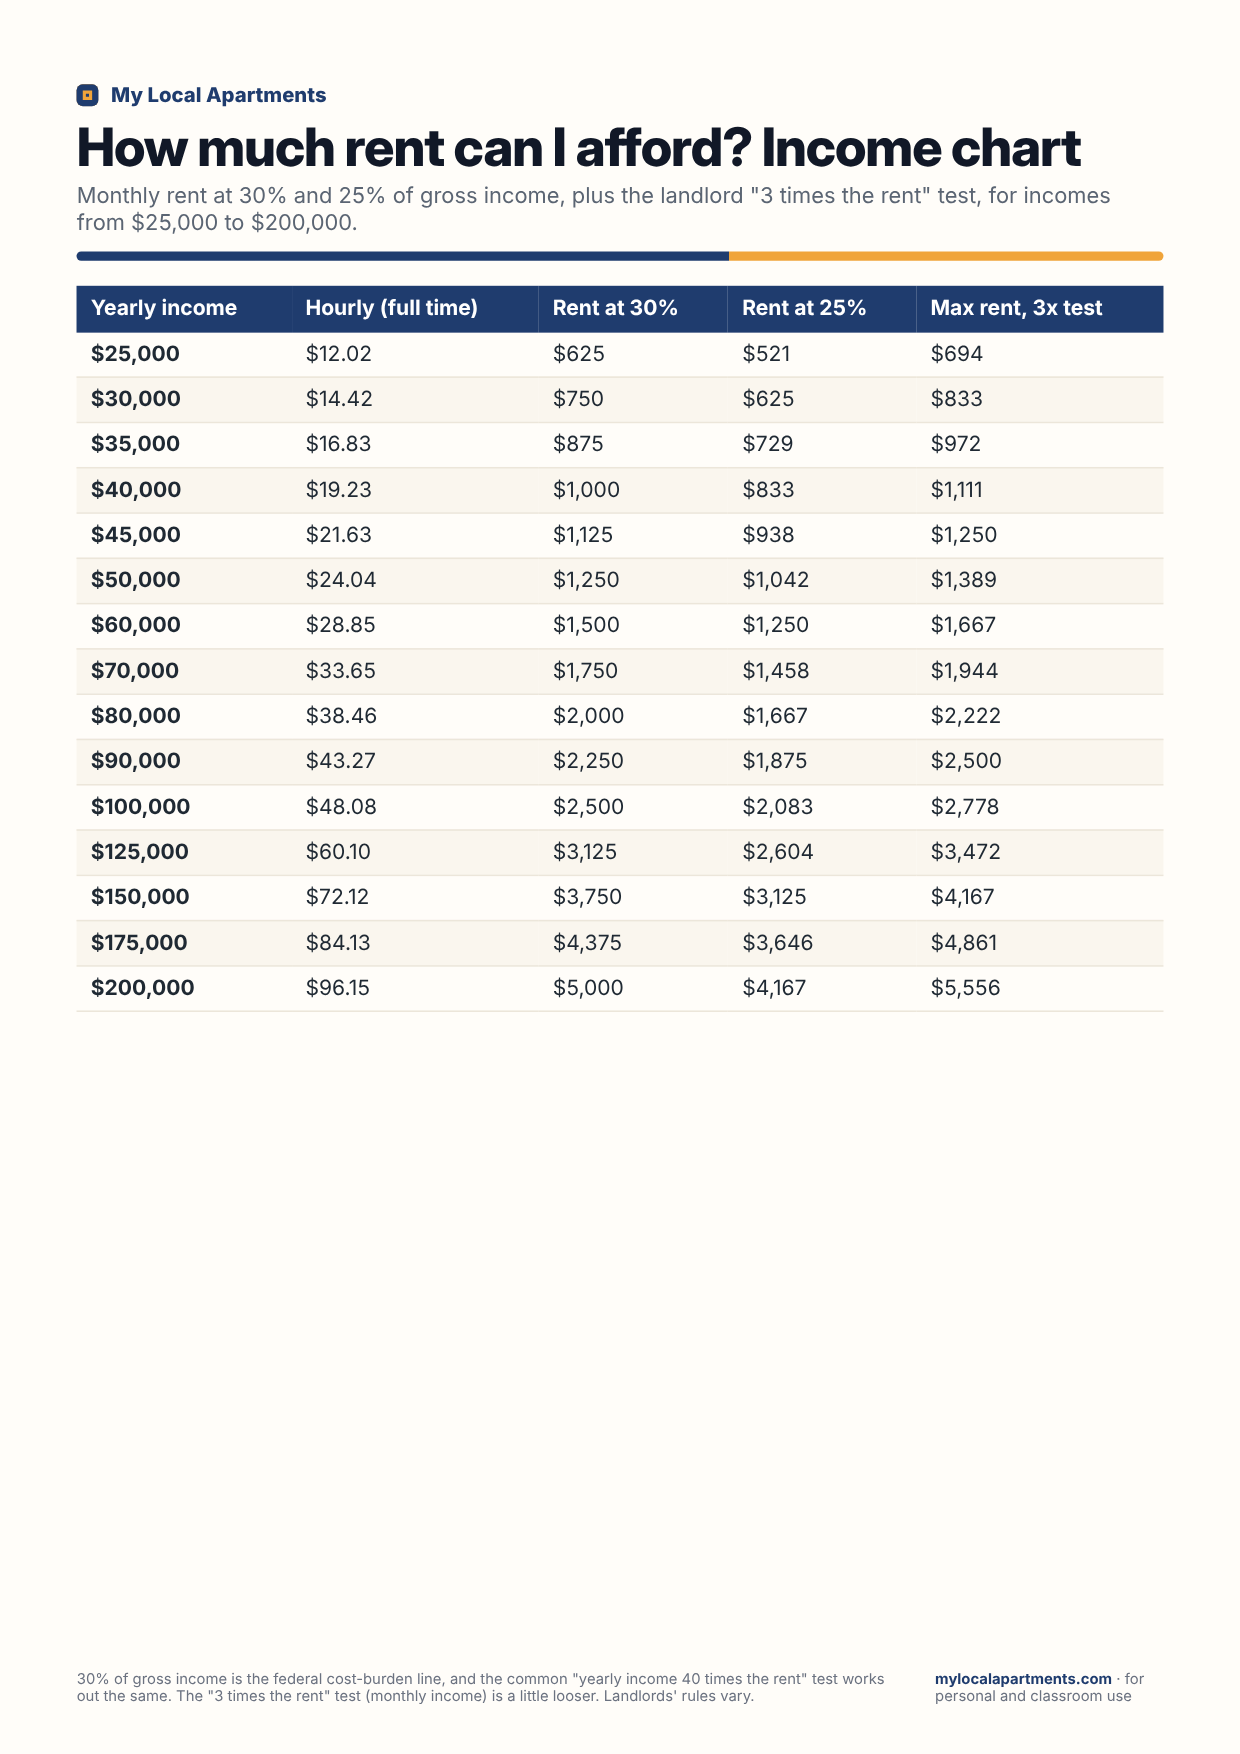
Monthly rent at 30% and 25% of gross income, plus the landlord "3 times the rent" test, for incomes from $25,000 to $200,000.
| Yearly income | Hourly (full time) | Rent at 30% | Rent at 25% | Max rent, 3x test |
|---|---|---|---|---|
| $25,000 | $12.02 | $625 | $521 | $694 |
| $30,000 | $14.42 | $750 | $625 | $833 |
| $35,000 | $16.83 | $875 | $729 | $972 |
| $40,000 | $19.23 | $1,000 | $833 | $1,111 |
| $45,000 | $21.63 | $1,125 | $938 | $1,250 |
| $50,000 | $24.04 | $1,250 | $1,042 | $1,389 |
| $60,000 | $28.85 | $1,500 | $1,250 | $1,667 |
| $70,000 | $33.65 | $1,750 | $1,458 | $1,944 |
| $80,000 | $38.46 | $2,000 | $1,667 | $2,222 |
| $90,000 | $43.27 | $2,250 | $1,875 | $2,500 |
| $100,000 | $48.08 | $2,500 | $2,083 | $2,778 |
| $125,000 | $60.10 | $3,125 | $2,604 | $3,472 |
| $150,000 | $72.12 | $3,750 | $3,125 | $4,167 |
| $175,000 | $84.13 | $4,375 | $3,646 | $4,861 |
| $200,000 | $96.15 | $5,000 | $4,167 | $5,556 |